 This tutorial is part of our tutorial series on WordPress Management and WordPress Optimization.
In this tutorial, we explore a number of WordPress plugins that display important information about your website’s health from your WordPress dashboard and that help you monitor your site to avoid serious problems caused by memory overload or database errors.
***
Monitoring WordPress Site Health From Your WordPress Dashboard
In addition to doing website maintenance on a regular basis, it’s important to constantly monitor the health of your WordPress site, especially if your business depends on your site being up and running and problem-free.
Some WordPress installations can run out of available PHP memory if the memory limit is set too low. This can lead to “fatal” error messages, or “blank” screens that show no information at all.
If you are hosting your website on a shared server with limited resources, you may want to monitor resources like PHP memory and database size usage to avoid problems. Additionally, you may want to have information like server IP address, page load time, query count, etc. handy in case you run into technical problems and need to contact your hosting provider or someone with technical expertise.
Here are some handy WordPress plugins worth knowing about that can display important information about your website inside your WordPress admin dashboard.
Database and Memory Usage Limits

(Database and Memory Usage Limits Plugin)
Database and Memory Usage Limits shows total memory usage and memory limits on your WordPress Dashboard and displays the memory load currently used by WordPress on the footer of your admin control panel.
This plugin is suitable for use with shared and dedicated hosting environments and reports issue with your website, such as theme and plugin bugs, WordPress errors, plugin bugs, slow page speed, extra resource usage and database errors.
For more details, go here:
Server IP & Memory Usage Display

(Server IP & Memory Usage Display WordPress Plugin)
This plugin displays the memory limit, current memory usage, WordPress memory limit, IP address, and PHP version in the admin footer.
Being able to see the IP address of where your WordPress installation is running is useful if you have many WordPress installations across several servers and IP addresses.
Once installed, the plugin displays color-coded indicators if the memory exceeds 75% (light red) and 90% (red). This allows you to immediately see if there’s enough memory available on your site. Additionally, the plugin displays the PHP version and your server’s operating system.
For more details, go here:
WP Server Stats

(WP Server Stats Plugin)
WP Server Stats lets you monitor your site’s most important server stats, like allocated memory, memory usage, CPU usage etc so you can easily see if something is wrong with your site and take corrective action (e.g. see if installing a new plugin creates excessive consumption of memory or CPU resources).
With this plugin installed, the site administrator will be able to see information on the WordPress dashboard such as:
- Server IP address
- Server location
- Server hostname
- Memory limit
- Realtime Amount & Percentage of memory usage
- Realtime CPU usage percentage
For more details, go here:
Memory Load And DB Size Usage

(Memory Load And DB Size Usage)
The Memory Load And DB Size Usage plugin displays the PHP memory load consumption and database usage on your dashboard footer, and admin toolbar.
This is useful when you’ve got limited PHP memory available, or a limited database quote, and need to keep track of how much you’ve got left.
For more details, go here:
WP Page Load Stats

(WP Page Load Stats Plugin)
WP Page Load Stats displays memory, page load time, average load time, and query count in the footer of your site.
For more details, go here:
Strictly System Check

(Strictly System Check – WordPress Plugin)
Strictly System Check is a site monitoring tool that allows website administrators to regularly check the status of their site and to be notified if the site goes down or becomes overloaded.
As the plugin author states, this plugin is not a replacement for professional server monitoring tools, but it can notify you when your site is down and help rescue your system from corrupt database tables before you even realize there has been an issue.
In addition to checking your database for corrupt tables and automatically repairing these, the plugin provides additional features such as:
- Select which URL is scanned when the system check is carried out,
- Search for a key phrase or text string in the source code and raise a report if it’s not found,
- Check the server load and report if it’s over a specified limit,
- Check the database load to ensure that it’s not overloaded and not running too many queries,
- Check that the system is not suffering poor performance due to fragmented table indexes,
- Report the number of connections, queries, reads, writes, aborted connections, and slow queries,
- Specify threshold limits for the web server and database loads. If these limits are reached or if the site is inaccessible, a report will automatically be sent with details of the response time it took to load the page, the current server load, the current database load and whether or not there were connection problems, issues with corrupt tables that needed repairing or fragmented indexes that were optimized, etc. This is useful information to have if you are troubleshooting errors on your WordPress site.
For more details, go here:
WordPress Site Condition

(WordPress Site Condition Plugin)
WordPress Site Condition monitors areas like database performance, memory usage, peak memory usage, page load time, average page load time, etc. and displays the condition of your WordPress site in charts.
For more details, go here:
Plugin Configuration & Usage
With most of the plugins listed above, there is nothing to configure once the plugin has been installed and activated. The plugin will monitor your website’s resources and display the information on your dashboard (either in the toolbar or footer, or both), allowing you to monitor the usage of these resources.
For example, you may see an indicator on your admin toolbar showing you the memory load of your installation …

(Information displayed in your WordPress admin toolbar)
Or, you may see your database and memory information on the footer of your page …

(Information displayed in your WordPress dashboard footer section)
If you find that memory usage is getting too close to the limit, see this tutorial or contact your host to request a memory increase or discuss other options (e.g. server upgrade, etc …)
Finding Similar WordPress Plugins
WordPress makes available many plugins that can help you monitor important technical aspects of your website. The easiest way to search for these is to go to your WordPress administration area, and select Plugins > Add New …

(Plugins Menu – Add New)
In the ‘Add Plugins’ screen, type in a keyword related to the technical area of your site that you would like to monitor into the search field (e.g. “memory”), then go through the search results – you will be amazed at some of the plugins you will find and what they can do …

(Add Plugins screen)
![]()
If you find that your site’s memory usage is getting too close to the limit, see this tutorial, or contact your web host to request a memory increase, or discuss other options (e.g. server upgrade, etc …)
![]()
If you run an e-commerce store using WooCommerce, you can view and print out a detailed system report to troublehoot errors or issues by going to WooCommerce > Status and clicking on the ‘System status’ tab …
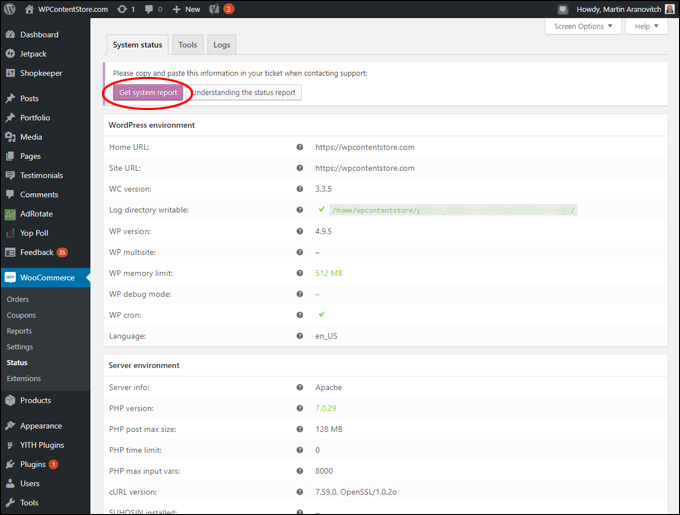
(WooCommerce system report)
Related Tutorials
To learn how to increase your WordPress memory limit for uploading larger files, see the tutorial below:
To learn more about managing your WordPress database, see the tutorial module below:
To learn more about troubleshooting common WordPress errors, see the tutorial module below:
To learn more about optimizing WordPress, see the tutorial module below:
Hopefully, you have found this tutorial on WordPress plugins that can help you monitor the health of your website and your server resources useful.

***
"I was absolutely amazed at the scope and breadth of these tutorials! The most in-depth training I have ever received on any subject!" - Myke O'Neill, DailyGreenPost.com